Market Insights & Blogs

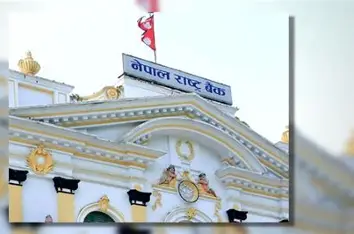
Banks are allowed to sell their share investments only after 45 days.
Banks and financial institutions are now allowed to sell shares of companies listed on the securities market after just 45 days of investment. The central bank issued a directive on Thursday reducing the previous holding period from 6 months to only 45 days. Until now, banks were required to hold their investments in the capital market for at least 6 months. Following Thursday’s directive, banks and financial institutions can now invest with a plan to sell shares or debentures after 45 days. According to the directive, investment in shares and debentures of listed organized institutions in the securities market must be for a period of more than 45 days. In addition, the central bank has introduced a provision that prohibits any form of short-term investment in shares and debentures of organized institutions through any mechanism. The central bank has also stipulated that banks and financial institutions must include policy-related provisions in their investment policies and procedures. These procedures should cover the objectives and strategies of investment, the types of instruments such as shares and debentures in which investment can be made, and the classification of these instruments into banking book and trading book.

BNHC: Fundamental Analysis after Right Share Issue
Buddha Bhumi Nepal Hydro power Company Limited, listed on the Nepal Stock Exchange (NEPSE) under the symbol BNHC, has a paid up capital of Rs. 800,000,000. BNHC had reported a significant improvement in its fourth-quarter financial performance in FY 2082/83 after recording losses in the previous two fiscal years. Lets look at some of the fundamental indicators of BNHC in the last three fiscal years. Comparison of BNHC's fourth-quarter financial statements for FY 2080/81, FY 2081/82 and FY 2082/83 are shown in a table below: 4th Quarter 2080/81 2081/82 2082/83 Net Profit/ Loss (Rs.) (14,889,778.32) (22,594,427.47) 12,074,483.60 EPS (Rs.) (3.72) (5.65) 1.81 Net Worth per Share (Rs.) 87.29 77.94 100.59 P/E Ratio 171.12 89.80 186.91 PBV Ratio 4.83 3.61 2.77 As shown in the above table, BNHC reported a net profit of Rs. 12,074,483.60 in 4th quarter of FY 2082/83. The profit was in negatives in FY 2080/81 and FY 2081/82. As EPS is affected by the net profit, it followed the same pattern and remained negative for two years before recovering to Rs. 1.81 in the last year’s 4th quarter. P/E ratio and PBV ratio had also shown fluctuation due to changing market. One of the important news during 4th quarter of FY 2082/83 was that the company issued 100% right shares worth Rs. 40 Crores through the issue of 40 lakhs (1: 1) units of right shares to its existing shareholders. The company's paid-up capital was Rs. 40 Crores and after the adjustment of the proposed right share, the company's paid-up capital had increased to Rs. 80 Crores. Out of the 40,00,000 right shares, eligible shareholders were allotted 35,25,304 shares, representing 88.13% of the issue. The remaining 4,74,696 shares, representing 11.86%, remained unclaimed and were subsequently offered through auction at a cut off price of Rs. 296. Retained earning and reserves of BNHC was in negatives and net worth per share was also less than par value before the right share issue and now we can see Rs. 30,59,034.54 allotted for reserves and net worth per share increased from Rs. 77.94 to Rs. 100.59 which could be the result of auction, as around Rs. 10 cr. was generated from it. More than 12 lakh shares have already been traded after right share was listed in NEPSE which is around 30% of total listed shares. Due to this, volume seems to be drying up in the recent days which could result in some price fluctuations in the coming days.

Fundamental analysis and Price Behavior after expiration of Lock-in period of SMJC
Sagarmatha Jalbidhyut Company Limited is a hydro-power company with the paid up capital of Rs. 1,173,200,000 and listed in NEPSE as SMJC. It was established in November 2015 in Kathmandu. SMJC together with its subsidiaries and jointly controlled entities has an installed gross generation capacity of over 18 MW. Lets look at some of the fundamental indicators of SMJC in the last three fiscal years. Comparison of SMJC's fourth-quarter financial statements for FY 2080/81, FY 2081/82 and FY 2082/83 are shown in a table below: 4th Quarter 2080/81 2081/82 2082/83 Net Profit (Rs.) 49,971,193 25,564,054 44,387,814 EPS (Rs.) 4.84 2.28 3.78 Net Worth per Share (Rs.) 109.55 106.62 109.59 P/E Ratio 83.80 233.59 112.67 PBV Ratio 3.47 4.93 3.87 As shown in the above table, SMJC reported a net profit of Rs. 49,971,193 in 4th quarter of FY 2080/81. The profit declined to Rs. 25,564,054 in FY 2081/82, before recovering to Rs. 44,387,814 in FY 2082/83. As EPS is affected by the net profit, it followed the same pattern. Net worth per share also decreased in FY 2081/82 and recovered in FY 2082/83. The decline in EPS during FY 2081/82 resulted in a significant increase in the P/E ratio to 233.59. One of the important news during 4th quarter of FY 2082/83 was the expiry of the lock-in period on SMJC shares. The company published a notice stating that the lock-in period of its promoters, local residents of the project affected area and employees' shares, will expire on 16th Chaitra, 2082. The expiry meant that shares that had previously been restricted from trading could become available in the secondary market, increasing the potential supply of SMJC shares. Increment of more than 85 Lakh share as floating shares would definitely affect market liquidity which in-turn pressurizes the supply and price fluctuation in the secondary market. After the locking period expires more than 25 Lakh shares has been transacted and half of the number could be from the recently opened shares. Recently the supply appears to be drying up, if we watch the daily volume in the floor sheet. So we could anticipate that SMJC gives a upward move in near future.
Financial Analysis of Nepal Bank Limited, A Bank to Keep in Portfolio
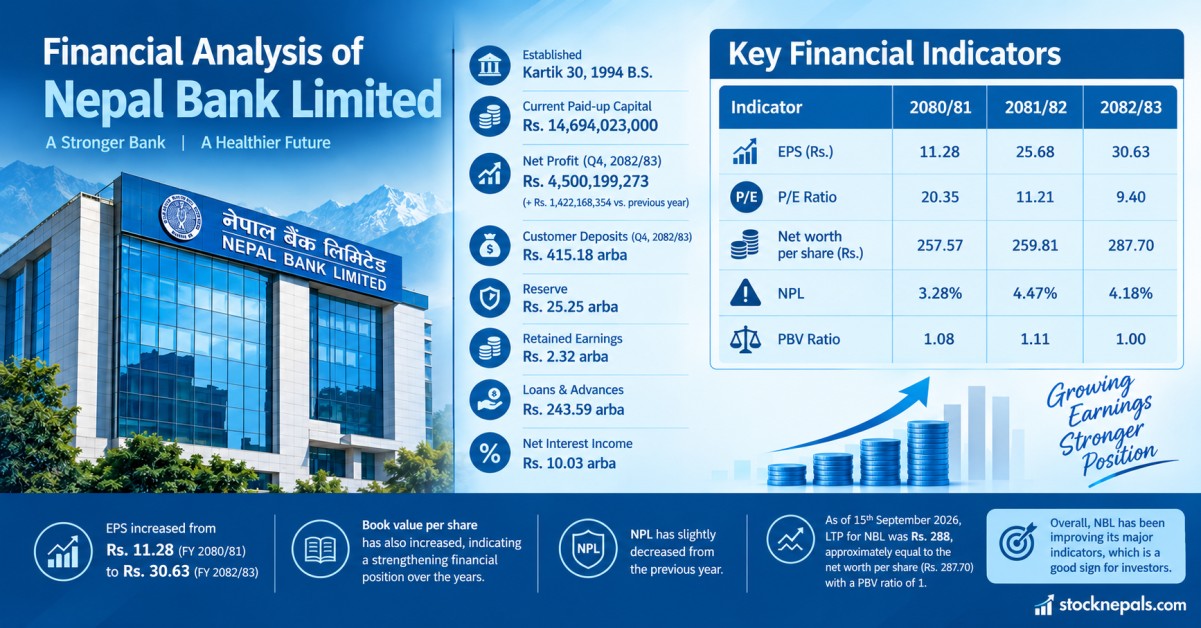
Nepal bank limited is the first commercial bank of Nepal established on Kartik 30, 1994B.S. with a current paid-up capital of Rs. 14,694,023,000. NBL has reported net profit of Rs. 4,500,199,273 in the 4th quarter of the fiscal year 2082/83 which is Rs. 1,422,168,354 more than what was reported in 4th quarter of the previous corresponding year. NBL had accumulated Rs. 415.18 arba deposits from customers in the 4th quarter of 2082/83. It had reserve of Rs. 25.25 arba and retained earnings of Rs. 2.32 arba. Loans and advances to customers stood at Rs. 243.59 arba while net interest income stood at Rs. 10.03 arba. Key financial indicators: Fiscal Year 2080/81 2081/82 2082/83 EPS(Rs.) 11.28 25.68 30.63 P/E ratio 20.35 11.21 9.40 Net worth per share (Rs.) 257.57 259.81 287.70 NPL 3.28% 4.47% 4.18% PBV Ratio 1.08 1.11 1 As we can see in the above given table, NBL's EPS increased from Rs. 11.28 in FY 2080/81 to Rs. 30.63 in FY 2082/83. Book value has also increased which indicates the bank’s strengthening financial position over the years. NPL has slightly decreased from the previous year. As of 15th September 2026, the LTP for NBL was at Rs. 288 which tells us that the market price was approximately equal to the bank's net worth per share of Rs. 287.70 further validated by the PBV ratio of 1. All of this shows that the bank has been improving its major indicators which is a good sign for investors.
.png)
FINANCIAL ANALYSIS OF HPPL AND RFPL, Could be better stocks in Hydropower Sector
HPPL and RFPL are hydro-power projects listed under NEPSE. Both of these companies had issued right shares in the fiscal year of 2082/83 resulting in the increase of their paid-up capital. HPPL has the paid-up capital of Rs. 1,598,125,500 according to its financial report of 4th quarter of fiscal year 2082/83. As HPPL has issued right shares of 1:0.5 ratio, its paid-up capital has increased in the fourth quarter and share premium has also been shown as 4,68,740 shares had been auctioned as ordinary shares. Table: Financial analysis of HPPL Company 4th Quarter Paid-up Capital(NPR) Share Premium (NPR) EPS Net worth per share Dividend capacity HPPL 2080/81 1,065,417,000 - -24.62 109.29 - 2081/82 1,065,417,000 - 6.82 116.10 16.10 2082/83 1,598,125,500 117,310,666 12.57 130.56 30.56 As for RFPL, it has the paid-up capital of Rs. 1,40,00,00,000 as shown in the financial report of 4th quarter of fiscal year 2082/83. RFPL had issued 1:1 ratio of right shares and auctioned 1,038,924 units. Table: Financial analysis of RFPL Company 4th Quarter Paid-up Capital(NPR) EPS Net worth per share Dividend capacity RFPL 2080/81 70,00,00,000 8.82 100.14 0.14 2081/82 70,00,00,000 0.15 100.52 0.52 2082/83 1,40,00,00,000 2.71 119.78 19.78 As we can see, there is a notable change in both company’s EPS and net worth capacity following the right share issue and paid up capital increase. The P/E ratio of HPPL and RFPL are 30.19 and 124.61 respectively while PBV ratio are 2.91 and 2.82 respectively. We can say that compare to some of the companies with similar paid up capital and similar market share price, these two seem better for the investors as their profitability has increased and have shown significant improvement in the fundamental indicators.





 (1) (3).png)

.png)




.png)
.png)


