
Market Insights & Blogs

Prabhu Insurance: Fundamental Analysis and Market Risks
Prabhu Insurance Company Limited is one of the non-life insurance companies of Nepal listed in NEPSE as PRIN with a paid-up capital of Rs. 1,84,89,39,200 and has 1,84,89,392 units of listed shares. Prabhu Insurance has been providing insurance services through its 60 branches/sub-branches all over Nepal. Let's look at the fundamental indicators of PRIN in the FY 2082/83 and compare it to the previous corresponding year’s same quarter: 4th Quarter 2080/81 2081/82 2082/83 Net Profit (Rs.) 9,94,83,233 1,16,69,968 3,48,87,820 EPS (Rs.) 34.05 14.70 13.33 Net Worth per Share (Rs.) 222.19 235 193 P/E Ratio 24.25 62 50.12 PBV Ratio 3.71 3.87 3.46 Net claims incurred(Rs.) 2,22,02,839 8,91,54,113 9,05,70,589 PRIN experienced a significant fluctuation in profitability over the three fiscal years. Its net profit declined sharply from Rs. 9.94 crore in FY 2080/81 to approximately Rs. 1.16 crore in FY 2081/82. However, the company recovered in FY 2082/83, reporting a net profit of Rs. 3.48 crore. The company's EPS has followed a declining trend as well, falling from Rs. 34.05 to Rs. 14.70 and further to Rs. 13.33 in FY 2082/83 which does not bode well for investors. Net worth per share increased from Rs. 222.19 to Rs. 235 and then it declined to Rs. 193 in FY 2082/83. The P/E ratio increased from 24.25 in FY 2080/81 to 62 in FY 2081/82 before declining to 50.12 in FY 2082/83. PBV ratio does not seem to have fluctuated drastically as the P/E ratio. Net claims incurred increased from Rs. 2.22 crore to Rs. 8.91 crore and further to Rs. 9.05 crore in FY 2082/83. The non-life insurance business is particularly exposed to unexpected events such as floods, landslides, fires, accidents and other natural or human-induced disasters. Such events can increase insurance claims. In addition to these political instability and economic uncertainty can influence investor confidence and share prices in the secondary market. Some of the examples can be taken from the recent Bhotekoshi flood and the gen-z protest that happened last year. The Gen Z protests of 23–24 Bhadra 2082 , were among the major events that affected Nepal's economic and financial environment. The impact of these major events extended across several sectoral indices of NEPSE. NEPSE declined by 1.33% while the non-life insurance sub index declined by 1.26% on the day of protest. NEPSE had to be shut down for several days and when it reopened the non-life insurance sub index declined even more by 5.43% on the first trading day. PRIN’s share price also declined by 0.96% on the day of protest followed by further decline by 3.95% and 4.32% in the later two consequent trading days. Claims arising from vandalism, arson and damage to commercial and private buildings, claims relating to damaged vehicles, and claims relating to damaged infrastructure and construction projects increased drastically as an impact of gen-z protest. The company's financial statements did show that net claims incurred increased from Rs. 8.91 crore in FY 2081/82 and Rs. 9.05 crore in FY 2082/83 and this could have contributed to it. Another major event affecting Nepal's insurance industry was the Bhotekoshi flood on 10th Bhadra 2083. The non-life insurance sub-index declined by 5.03% during this period. Share prices of all 13 non-life insurance companies declined during the trading session. The same downtrend continued in the following few trading sessions. The preliminary claim amount reported for Prabhu Insurance was approximately Rs. 3 crore as of 15th Bhadra, 2083. This suggests that PRIN had relatively limited exposure to the major insured assets affected by the flood as it showed the least claim count among other non-life insurance companies. However, preliminary claims are not necessarily equal to the final amount payable after damage assessment and policy verification. Both events influenced the secondary market and the share price movement of Prabhu Insurance. PRIN declined by 6.25% on the day of the Bhotekoshi flood, followed by another significant decline on August 31st as we can see in the following table: Date Closing Price(Rs.) Difference(%) August 25 640 -0.47 August 26 600 -6.25 August 27 599.60 -0.07 August 31 573.20 -4.40 September 1 584.90 +2.40 One of the events that also affected the price movement of PRIN is that the company decided to distribute 8.7% bonus shares worth Rs. 14.79 crores which translates to 14,79,831.65 unit bonus shares listed in NEPSE on August 27, 2026 which coincided with the flood. As a result we can see that on August 27 the price decreased minimally. As of November 5, PRIN’s closing price is at Rs. 585. Conclusion Prabhu Insurance has demonstrated a recovery in net profit during FY 2082/83, but its declining EPS, reduced net worth per share and increased claims incurred indicate that the company still faces financial challenges. And the impact of the Bhotekoshi flood has yet to become clear through quarterly financial statements of FY 2083/84. Therefore, we should not evaluate Prabhu Insurance solely on its recent improvement in net profit. Its ability to manage claims, protect its capital and maintain sustainable earnings will be equally important in determining its future financial performance and market valuation.

November may bring renewed buying interest in NEPSE, driven by Q1 reports, what does historical data says ?
To understand why the market may gain momentum around November, it is helpful to look at the events that typically influence share prices from the end of the previous fiscal year through the beginning of the new fiscal year. 1. The Annual Reports and Dividend Season: Ashadh and Shrawan Ashad is the month for anticipating the better annual financial reports of companies. And that of Shrawan is particularly important for the Nepal's only stock market NEPSE because listed companies begin publishing their fourth-quarter and annual financial reports and announcing or proposing dividends. Banks and financial institutions are especially closely watched during this period because of their earnings, capital adequacy, non-performing loans, and dividend-paying capacity. These announcements can create optimism among investors. Companies reporting strong earnings or proposing attractive dividends may attract increased buying interest, while weaker financial results can put pressure on their share prices. 2. Dividend Adjustments and Profit Booking: Bhadra and Asoj Following the annual results and dividend announcements in Shrawan and the subsequent months, the market may enter a period of correction during Bhadra (mid-August to mid-September) and Asoj (mid-September to mid-October). Investors who purchased shares in anticipation of strong annual results or attractive dividends may decide to sell after prices have increased. When a significant number of investors take profits simultaneously, selling pressure could push share prices downward. Share prices adjust around dividend-related corporate actions. When a stock trades ex-dividend, its market price may adjust to reflect the value of the dividend distributed. Once annual financial results and dividend proposals become available, the market has more information to evaluate companies. If share prices have risen beyond what investors consider justified by earnings and future prospects, a correction may follow. 3. Why November (Kartik–Mangsir) Could Bring Renewed Buying Interest Share market does not follows a straight forward up or down, if risen then definitely would down and vice-versa. After the market experiences possible corrections during Bhadra/ Ashoj, Kartik/ Mangsir may provide an opportunity for renewed buying interest after exhausted selling. Investors can begin assessing share prices based on updated financial information, business prospects, earnings quality, and prevailing market conditions. First-quarter financial results of new fiscal year are also generally published around Kartik. These reports allow investors to examine revenue growth, net profit, earnings per share, and other financial indicators. If companies report improving earnings, their shares may attract additional demand. Conversely, disappointing results can create selling pressure. Monthly return in November in comparison to October in the last ten years: Year October closing points (approx.) November closing points (approx.) November return 2016 1,760 1,608 −8.60% 2017 1,533 1,538 +0.27% 2018 1,222 1,149 −5.98% 2019 1,146 1,113 −2.91% 2020 1,646 1,997 +21.35% 2021 2,837 2,628 −7.37% 2022 1,875 1,950 +4.00% 2023 1,864 1,858 −0.32% 2024 2,677 2,748 +2.63% 2025 2,600 2,649 +1.89% The figures given in the above table illustrate that November recorded positive returns in five of those ten years, but the negative return in the rest of the five years demonstrates that increase in NEPSE is not guaranteed. If we observe this year's data, NEPSE has reached 2,664.06 points with turnover amounting to Rs. 7.45 Arba, with 19,397,548 shares traded as of October 28, so, we can see that NEPSE is increasing with volume. Whether this momentum continues will depend on subsequent market developments. For investors, the key takeaway is to treat November's potential seasonal recovery as a possibility, not a prediction.
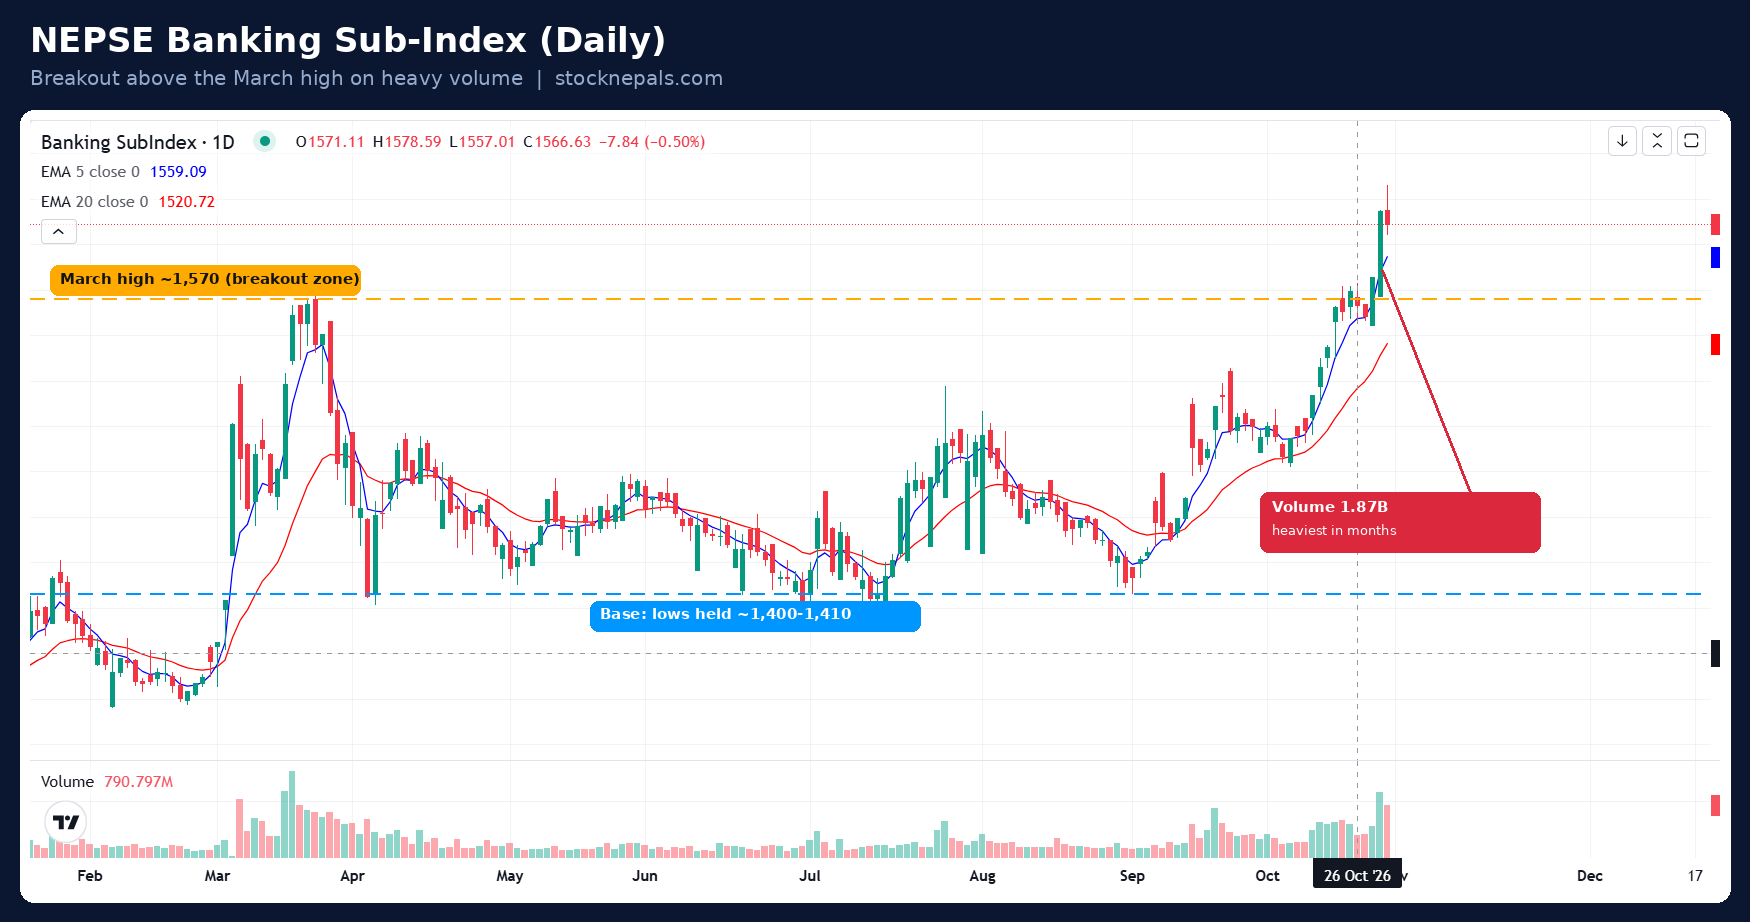
Banking Sub-Index Breaks Out: Rally or Trap?
Nepal’s commercial banks have made a strong move over the past few weeks. The Banking Sub-Index, which spent most of the year stuck in a sideways range, has pushed to around 1,611 on the daily chart. That is roughly 14% above the early-September low near 1,408, and above the March high of about 1,570-1,575, which had capped every rally since. What the chart shows From April to September the index moved in a wide range, roughly 1,400 to 1,520, with the July and September lows both holding near 1,400-1,410. That kind of base-building often comes before a larger move. In October the index cleared the 1,500 mark, then the March high, and printed an intraday peak near 1,630. Price now sits above both moving averages. The 5-day EMA is around 1,593 and the 20-day EMA around 1,545, with the short average well above the long one, which confirms the strength of the uptrend. The volume is just as important. The latest session shows turnover of about 1.87 billion, the heaviest in the recent window and well above the typical 500-800 million days seen through the summer. A breakout to a new high on rising volume is a sign of real participation, not a thin drift upward. The latest candle, however, is red with a long upper shadow. Buyers pushed price toward 1,630 but could not hold it, which suggests some profit-taking at the highs. The Q1 reports: why the market is split The first-quarter banking reports have been mixed, and that leaves two possible readings of this rally. Possibility 1: “Buy the rumor, sell the news.” The index may have run up on expectations ahead of the results. If the numbers are not strong enough to justify the move, early buyers may use the news to book profits. In that case we could see a correction in banking stocks, with the 5-day EMA (~1,593) as first support, then the 20-day EMA (~1,545), and the old March high near 1,570 as a retest zone. Possibility 2: A bigger move for NEPSE as a whole. Banking stocks are the core of margin-eligible stocks, the ones investors pledge as collateral to take margin loans. When banks rise, the value of pledged portfolios rises, borrowing capacity increases, and fresh buying power flows into the wider market. If this is what is happening, the banking breakout may be the leading edge of a broader NEPSE rally, not an isolated sector move. What to watch The next few sessions should decide between the two. A pullback that holds above the March breakout zone and the 20-day EMA, on falling volume, would be a healthy retest and support the bullish case. A sharp drop back below ~1,570 on heavy volume would suggest the breakout failed and Possibility 1 is playing out. Either way, chasing a vertical move is risky, so wait for confirmation and manage position size. This article is for educational purposes only and is not investment advice.
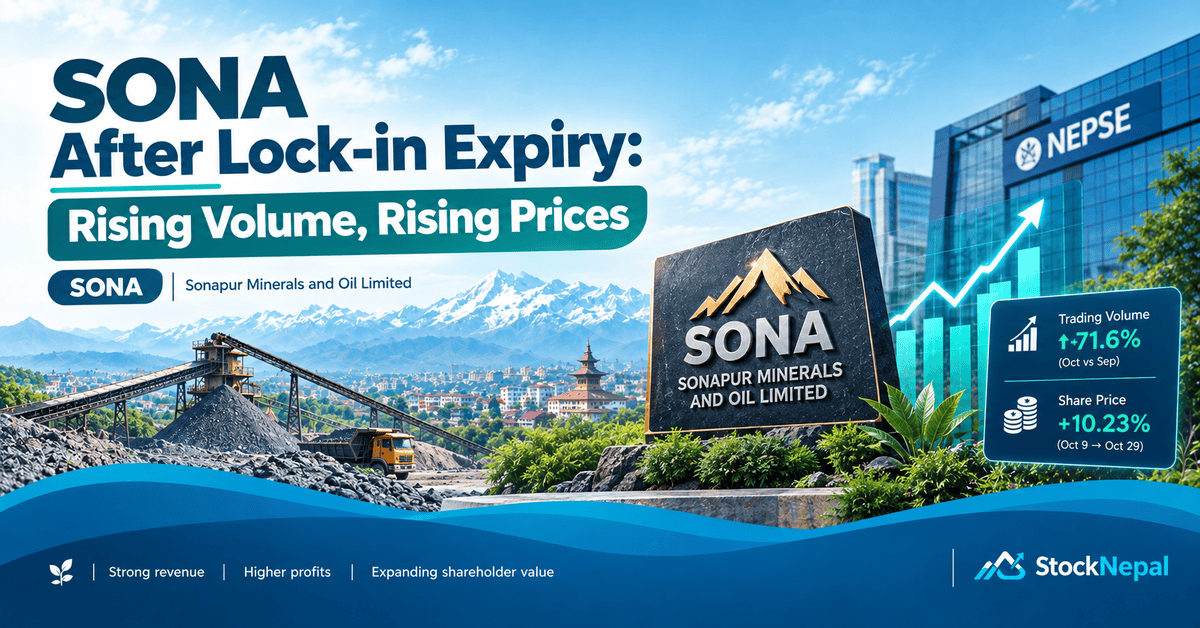
SONA After Lock-in Expiry: Rising Volume, Rising Prices
Sonapur Minerals and Oil Limited (SONA), listed on the Nepal Stock Exchange (NEPSE), has paid up capital of Rs. 3,075,050,000 and has attracted attention of investors following the conclusion of the lock-in period for its promoter and employee shares on October 9, 2026. Among the 30,750,500 shares listed on NEPSE, the promoters held 18,450,300 units, and the company's employees held 19,500 units. The company recorded a volume of 2.724 million during the month through October 29, while 1.586 million volume was recorded in September which indicates the increase in trading activity despite there being less trading days in October. The immediate trading sessions surrounding the lock-in expiry were particularly active. On October 8, SONA recorded a volume of 282.47k, followed by around 313.043k on October 9, the date the lock-in period concluded. Generally, right after the conclusion of the lock-in period, investors anticipate increased supply and potential selling pressure; however, in SONA’s case the increase in trading activity has not translated into a sustained decline in its share price. Why? So, first of all, the conclusion of a lock-in period does not automatically mean that shareholders will sell their holdings. It simply removes a restriction on eligible shares. Promoters may continue holding their shares because of their long-term outlook, valuation expectations or strategic interests in the company. And this case just might be the perfect example because the lock-in expiry coincided with increased market participation. Right after the conclusion period, SONA’s price did show some fluctuation for the first few trading days but the combination of higher trading activity after dashain and rising share prices due to consistent rise in NEPSE in the recent days suggests that buying demand was sufficient to absorb the shares being offered in the market during this period. Although, this does not establish whether the buyers were acquiring newly unlocked promoter holdings or shares already in circulation. SONA closed at Rs. 429 on October 9, compared with Rs. 420 at the end of September. As of October 29, its closing price had reached Rs. 472.90, representing an increase of approximately 10.23% from the October 9 closing price. The conclusion of SONA's lock-in period coincided with a significant increase in trading volume, yet its share price continued to rise. This suggests that the anticipated selling pressure has not dominated price action so far. However, the increase in volume alone does not establish whether newly unlocked shares have entered the market in significant quantities. Whether this trend continues will depend on actual selling behaviour, market demand and the company's broader fundamentals.

ILI: Fundamental Analysis
IME Life Insurance Company Limited is a company listed in NEPSE as ILI and started its operation from Bhadra 1, 2074 (August 17, 2017) offering a range of individual and group insurance solutions to meet the protection, saving, and investment needs of its customers. The Company has a paid up capital of Rs. 5,00,00,00,000. The promoters have contributed to 70% of paid up capital whereas the general public have contributed to 30% of it. Let's look at the fundamental indicators of ILI for the past three years in its 4th quarter financial reports: 4th Quarter 2080/81 2081/82 2082/83 Net Profit (Rs.) 51,45,57,880 58,33,01,763 58,42,44,356 EPS (Rs.) 10.29 11.67 11.68 Net Worth per Share (Rs.) 145.59 138.58 135.66 P/E Ratio 44.02 39.60 34.92 PBV Ratio 3.11 3.07 3.13 Net earned premium(Rs.) 4,52,21,23,291 5,49,49,46,759 7,46,30,24,166 Investment (Rs.) 15,34,68,91,740 17,54,05,86,937 23,28,76,91,492 ILI's net profit has shown consistent growth, increasing from Rs. 51.46 crore in FY 2080/81 to Rs. 58.33 crore in FY 2081/82 and further to Rs. 58.42 crore in FY 2082/83. EPS also increased from Rs. 10.29 to Rs. 11.67 and then Rs. 11.68 over the same period and P/E ratio has fallen from 44.02 to 34.92. The company's net worth per share has declined from Rs. 145.59 in FY 2080/81 to Rs. 138.58 in FY 2081/82 and Rs. 135.66 in FY 2082/83. The PBV ratio, meanwhile, remained relatively stable moving from 3.11 to 3.07 and then 3.13. The most significant improvement is visible in net earned premium. It increased from Rs. 4.52 arba in FY 2080/81 to Rs. 5.49 arba in FY 2081/82 and reached Rs. 7.46 arba in FY 2082/83. ILI’s Investments also grew significantly from Rs.15.34 arba to Rs. 17.54 arba and reached to Rs.23.28 arba in the same time frame. Investment jumped approximately 32.8% in FY 2082/83. Investment income is an important component of long-term profitability for any life insurance company. Overall, ILI's rising premiums, expanding investment portfolio, stable earnings, and declining P/E ratio provide positive signals.

UAIL Fundamental Analysis: Rising Claims, Falling Profits and a Challenging Road Ahead
United Ajod Insurance Limited is one of the non-life insurance companies in Nepal with the paid-up capital of Rs. 2,64,98,99,600, listed on the Nepal Stock Exchange (NEPSE) under the symbol UAIL. The company was formed through the merger of United Insurance Company (Nepal) Limited and Ajod Insurance Limited and began joint operations on 14 Jestha 2080. Let's look at the fundamental indicators of UAIL in the FY 2082/83 and compare it to the previous corresponding years same quarter: 4th Quarter 2080/81 2081/82 2082/83 Net Profit (Rs.) 38,52,85,131 21,64,32,841 6,30,99,830 EPS (Rs.) 5.28 9.37 2.73 Net Worth per Share (Rs.) 117.72 176.76 188.01 P/E Ratio 32.62 38.63 132.60 PBV Ratio 5.08 2.05 1.93 Net claims incurred(Rs.) 54,42,42,515 67,62,84,458 97,30,47,436 UAIL's net profit declined from approximately Rs. 38.53 crore in FY 2080/81 to Rs. 21.64 crore in FY 2081/82, before falling further to only Rs. 6.31 crore in FY 2082/83. EPS and P/E ratio are also to be affected by the lessening profit as EPS declined to just Rs. 2.73 in the latest quarter and P/E ratio also significantly increased to 132.6 times. One of the major events that affected Nepal's insurance industry during FY 2082/83 was the Gen Z movement of Bhadra, 2082. The protests resulted in widespread vandalism, arson and destruction of private property, vehicles, businesses and other insured assets. The protests occurred during the 1st quarter of FY 2082/83, precisely when UAIL subsequently reported a significant quarterly loss which they are slowly recovering from. Although UAIL’s net profit has taken a massive hit, its net worth per share seems to be rising as it increased from Rs. 117.72 to Rs. 188.01. This indicates that despite the recent decline in earnings, the company's shareholders' equity has not weakened. Net claims incurred have increased significantly as it increased from Rs. 54,42,42,515 in FY 2080/81 to Rs. 67,62,84,458 in FY 2081/82 to then Rs. 97,30,47,436 in FY 2082/83. In 2081/82, claims increased by 24.3% and in 2082/83, they increased by another 43.9% which is a huge leap. The company's FY 2082/83 indicators results were already weak. Then our country experienced severe flooding and related disasters in 2026. The August 26, 2026 Bhote Koshi flood has generated a particularly large insurance exposure for the industry. Higher claim expenses are expected to be the inevitable consequence of the flood which could further harm UAIL’s already declining profit and earnings. Investors often react negatively to uncertainty surrounding large insurance claims. This can put pressure on the stock price even before the final financial impact is known. This can further be supported by looking at UAIL’s stock prices decline. At the beginning of August this year the company’s stock price was at Rs. 445 then when the flood hit on August 26, the stock prices declined sharply to Rs. 397.2 and recently as of October 2nd, the closing price for UAIL was at Rs. 362 which indicates that the company have not been able recover and market sentiment is not favourable. Although there are risks of declining profits, earnings and dividends, UAIL's rising book value becomes particularly relevant here. An insurance company with stronger capital has a greater ability to absorb unexpected losses.

MAKAR: Fundamental Analysis and Behavior after Lock-in period
Makar Jitumaya Suri Hydropower Company Limited is a hydro-power company with a paid-up capital of Rs. 76,00,00,000 and listed in NEPSE as MAKAR. It was established in 2065 B.S. as a private company and was later transformed as public limited under the Company act 2053 on 2075 B.S. Makar Jitumaya Suri Hydropower Limited was incorporated on 31st Ashad, 2078, after the merger of Makar Jitumaya Hydropower Private Limited with Suri Khola Hydropower Limited. Let’s look at some of the fundamental indicators of MAKAR in its fourth-quarter financial statements published for FY 2080/81, FY 2081/82 and FY 2082/83: 4th Quarter 2080/81 2081/82 2082/83 EPS (Rs) (0.4817) 6.51 10.30 P/E Ratio (times) (943.10) 62.83 39.71 PBV Ratio (times) 4.88 3.91 3.57 Net-worth per share (Rs) 92.91 104.69 114.62 Net profit (Rs) (36,60,975) 4,94,92,461 7,82,43,927 We can see that the company has improved its fundamentals drastically as its net worth per share, net profit, and EPS all increased simultaneously from FY 2080/81 to FY 2082/83. P/E ratio and PBV ratio has also improved. The sharp improvement in MAKAR's financial indicators in FY 2081/82 was primarily supported by growth in electricity-generation and power-sales revenue as revenue generation became more substantial and consistent which MAKAR maintained in FY 2082/83 too. The company’s financial reports show that paid-up capital remained unchanged while profit and EPS increased substantially. Since the paid-up capital remained at Rs. 76,00,00,000, the improvement in earnings was reflected directly in profit and earnings per share. It also increased net worth per share without having to issue different shares. Behaviour After Lock-in Period Expiry MAKAR published a notice regarding the expiration of the lock-in period of its shares, that the lock-in period will expire on 28th Chaitra, 2082. The company now has 76,00,000 units of shares listed on NEPSE of which the promoters held 53,20,000 units, the residents of the project-affected held 6,78,600 units, and the company's employees held 32,028 units. These shares are now able to be traded in the secondary market. The company’s lock-in period expired at the end of third quarter of FY 2082/83. The total volume traded during the 30 trading sessions before the expiry was approximately 371.43 thousand shares, whereas the corresponding volume after the expiry increased to approximately 516.56 thousand shares. The increase in volume indicates that market activity in MAKAR was higher after the lock-in period expired. Approximately, 5.59 million shares have been traded since the lock-in period expired. Overall, MAKAR showed a significant improvement in its fundamental indicators between FY 2080/81 and FY 2082/83. The company moved from a net loss to sustained profitability. Trading activity also increased after the lock in period of its shares expired and if we compare the trading volume 30 trading days before and after the expiry there is approximately 39.1% increase in trading.

Navigating the NEPSE Bull Run: Introducing the All-New StockNepals.com
When the Nepal Stock Exchange (NEPSE) enters a bullish phase, the rising tide tends to lift many boats. However, relying on generalized market optimism or social media rumors is rarely a sustainable strategy for maximizing returns. To truly capitalize on a bull market, traders and investors need to pinpoint precisely which stocks hold genuine momentum, which are quietly consolidating for a breakout, and where the volume is heavily concentrating. To bridge this gap between market noise and actionable data, we are proud to announce the launch of the completely revamped StockNepals.com. With a smarter, clearer, and more powerful interface, the new platform is engineered to transform raw market data into high-probability trading setups. Here is a look at the newly integrated features designed to give you a definitive edge in the market. Spot the Right Opportunities with Precision The upgraded StockNepals dashboard categorizes the market into clear, actionable segments so you can align your strategy with your trading timeframe. 1. Trend & Momentum Tracking Bull Run Stocks: Instantly filter for stocks exhibiting strong, sustained uptrend momentum. Don't guess which stocks are leading the rally; let the data show you. Momentum Gaining Stocks: Catch opportunities early by identifying assets that are just beginning to accelerate in price and volume, allowing you to enter before the trend becomes exhausted. 2. Breakout & Range Analysis Ready to Break Out: Monitor stocks that are approaching critical resistance levels. This feature tracks early technical signs of an impending breakout, ensuring you are positioned for the surge. Consolidated Stocks: Find hidden gems that have been resting in a tight trading range. Identifying accumulation phases before the next big markup is crucial for maximizing risk-to-reward ratios. 3. Actionable Buy Signals Short Term Buy Stocks: Tailored for swing traders, this module spots highly probable near-term technical setups, helping you capture quick gains in a volatile market. Long Term Buy Signals: For the patient investor, this feature filters out the day-to-day noise to highlight structurally sound companies presenting technically optimal entry points for long-term holding. 4. Market & Sector Health Index Status: Get a bird's-eye view of overall market trends, sector performance, and broader NEPSE volatility at a glance. Sector Volume: Track exactly where the money is flowing. By analyzing volume distribution across different sectors, you can identify institutional interest and sector rotations before they are reflected in massive price spikes. Upgrade Your Trading Arsenal Today The same trusted insights you expect from StockNepals are now housed in a significantly better interface, designed for both quick screening and deep analysis. Whether you are timing a short-term swing or building a long-term portfolio, having the right data visualization makes all the difference. To celebrate this major version launch, we are offering an exclusive, limited-time discount for our early adopters. You can unlock the complete, premium StockNepals package for Just Rs. 1500 (a sharp discount from the previous Rs. 2500 price tag). Please note, this offer is strictly limited to the first 200 users. Take control of your portfolio and make smarter, data-driven decisions today. Claim Your Spot Now: 💬 Message us on WhatsApp: 9849825532 🌐 Visit our new platform: www.stocknepals.com
Banks are allowed to sell their share investments only after 45 days.
Banks and financial institutions are now allowed to sell shares of companies listed on the securities market after just 45 days of investment. The central bank issued a directive on Thursday reducing the previous holding period from 6 months to only 45 days. Until now, banks were required to hold their investments in the capital market for at least 6 months. Following Thursday’s directive, banks and financial institutions can now invest with a plan to sell shares or debentures after 45 days. According to the directive, investment in shares and debentures of listed organized institutions in the securities market must be for a period of more than 45 days. In addition, the central bank has introduced a provision that prohibits any form of short-term investment in shares and debentures of organized institutions through any mechanism. The central bank has also stipulated that banks and financial institutions must include policy-related provisions in their investment policies and procedures. These procedures should cover the objectives and strategies of investment, the types of instruments such as shares and debentures in which investment can be made, and the classification of these instruments into banking book and trading book.

BNHC: Fundamental Analysis after Right Share Issue
Buddha Bhumi Nepal Hydro power Company Limited, listed on the Nepal Stock Exchange (NEPSE) under the symbol BNHC, has a paid up capital of Rs. 800,000,000. BNHC had reported a significant improvement in its fourth-quarter financial performance in FY 2082/83 after recording losses in the previous two fiscal years. Lets look at some of the fundamental indicators of BNHC in the last three fiscal years. Comparison of BNHC's fourth-quarter financial statements for FY 2080/81, FY 2081/82 and FY 2082/83 are shown in a table below: 4th Quarter 2080/81 2081/82 2082/83 Net Profit/ Loss (Rs.) (14,889,778.32) (22,594,427.47) 12,074,483.60 EPS (Rs.) (3.72) (5.65) 1.81 Net Worth per Share (Rs.) 87.29 77.94 100.59 P/E Ratio 171.12 89.80 186.91 PBV Ratio 4.83 3.61 2.77 As shown in the above table, BNHC reported a net profit of Rs. 12,074,483.60 in 4th quarter of FY 2082/83. The profit was in negatives in FY 2080/81 and FY 2081/82. As EPS is affected by the net profit, it followed the same pattern and remained negative for two years before recovering to Rs. 1.81 in the last year’s 4th quarter. P/E ratio and PBV ratio had also shown fluctuation due to changing market. One of the important news during 4th quarter of FY 2082/83 was that the company issued 100% right shares worth Rs. 40 Crores through the issue of 40 lakhs (1: 1) units of right shares to its existing shareholders. The company's paid-up capital was Rs. 40 Crores and after the adjustment of the proposed right share, the company's paid-up capital had increased to Rs. 80 Crores. Out of the 40,00,000 right shares, eligible shareholders were allotted 35,25,304 shares, representing 88.13% of the issue. The remaining 4,74,696 shares, representing 11.86%, remained unclaimed and were subsequently offered through auction at a cut off price of Rs. 296. Retained earning and reserves of BNHC was in negatives and net worth per share was also less than par value before the right share issue and now we can see Rs. 30,59,034.54 allotted for reserves and net worth per share increased from Rs. 77.94 to Rs. 100.59 which could be the result of auction, as around Rs. 10 cr. was generated from it. More than 12 lakh shares have already been traded after right share was listed in NEPSE which is around 30% of total listed shares. Due to this, volume seems to be drying up in the recent days which could result in some price fluctuations in the coming days.

Fundamental analysis and Price Behavior after expiration of Lock-in period of SMJC
Sagarmatha Jalbidhyut Company Limited is a hydro-power company with the paid up capital of Rs. 1,173,200,000 and listed in NEPSE as SMJC. It was established in November 2015 in Kathmandu. SMJC together with its subsidiaries and jointly controlled entities has an installed gross generation capacity of over 18 MW. Lets look at some of the fundamental indicators of SMJC in the last three fiscal years. Comparison of SMJC's fourth-quarter financial statements for FY 2080/81, FY 2081/82 and FY 2082/83 are shown in a table below: 4th Quarter 2080/81 2081/82 2082/83 Net Profit (Rs.) 49,971,193 25,564,054 44,387,814 EPS (Rs.) 4.84 2.28 3.78 Net Worth per Share (Rs.) 109.55 106.62 109.59 P/E Ratio 83.80 233.59 112.67 PBV Ratio 3.47 4.93 3.87 As shown in the above table, SMJC reported a net profit of Rs. 49,971,193 in 4th quarter of FY 2080/81. The profit declined to Rs. 25,564,054 in FY 2081/82, before recovering to Rs. 44,387,814 in FY 2082/83. As EPS is affected by the net profit, it followed the same pattern. Net worth per share also decreased in FY 2081/82 and recovered in FY 2082/83. The decline in EPS during FY 2081/82 resulted in a significant increase in the P/E ratio to 233.59. One of the important news during 4th quarter of FY 2082/83 was the expiry of the lock-in period on SMJC shares. The company published a notice stating that the lock-in period of its promoters, local residents of the project affected area and employees' shares, will expire on 16th Chaitra, 2082. The expiry meant that shares that had previously been restricted from trading could become available in the secondary market, increasing the potential supply of SMJC shares. Increment of more than 85 Lakh share as floating shares would definitely affect market liquidity which in-turn pressurizes the supply and price fluctuation in the secondary market. After the locking period expires more than 25 Lakh shares has been transacted and half of the number could be from the recently opened shares. Recently the supply appears to be drying up, if we watch the daily volume in the floor sheet. So we could anticipate that SMJC gives a upward move in near future.
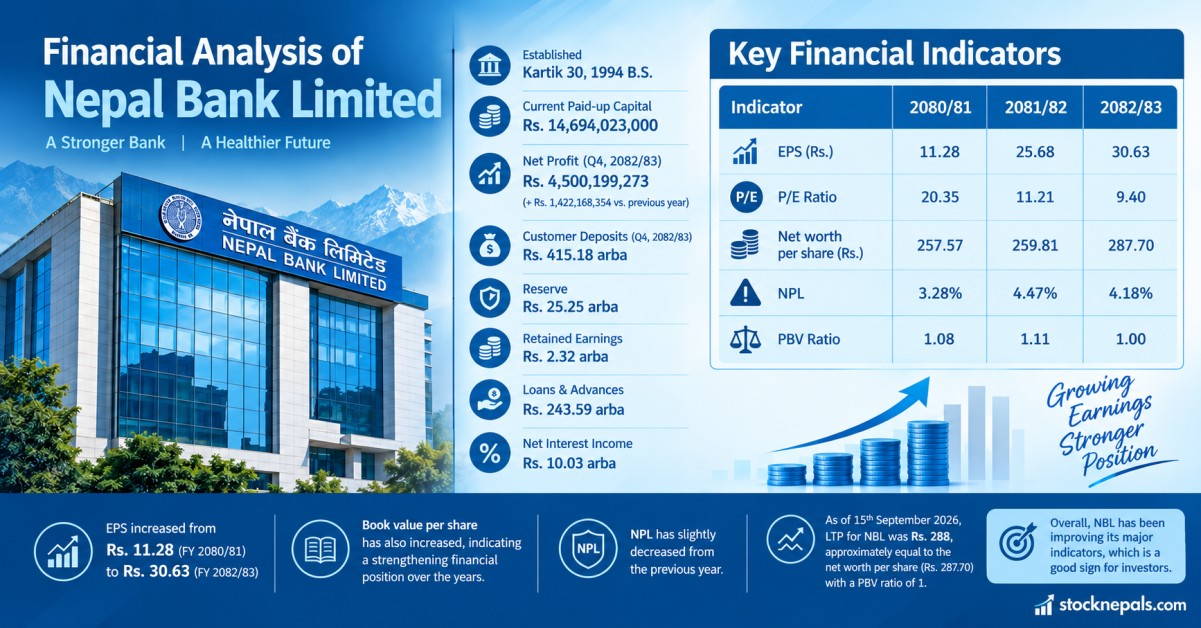
Financial Analysis of Nepal Bank Limited, A Bank to Keep in Portfolio
Nepal bank limited is the first commercial bank of Nepal established on Kartik 30, 1994B.S. with a current paid-up capital of Rs. 14,694,023,000. NBL has reported net profit of Rs. 4,500,199,273 in the 4th quarter of the fiscal year 2082/83 which is Rs. 1,422,168,354 more than what was reported in 4th quarter of the previous corresponding year. NBL had accumulated Rs. 415.18 arba deposits from customers in the 4th quarter of 2082/83. It had reserve of Rs. 25.25 arba and retained earnings of Rs. 2.32 arba. Loans and advances to customers stood at Rs. 243.59 arba while net interest income stood at Rs. 10.03 arba. Key financial indicators: Fiscal Year 2080/81 2081/82 2082/83 EPS(Rs.) 11.28 25.68 30.63 P/E ratio 20.35 11.21 9.40 Net worth per share (Rs.) 257.57 259.81 287.70 NPL 3.28% 4.47% 4.18% PBV Ratio 1.08 1.11 1 As we can see in the above given table, NBL's EPS increased from Rs. 11.28 in FY 2080/81 to Rs. 30.63 in FY 2082/83. Book value has also increased which indicates the bank’s strengthening financial position over the years. NPL has slightly decreased from the previous year. As of 15th September 2026, the LTP for NBL was at Rs. 288 which tells us that the market price was approximately equal to the bank's net worth per share of Rs. 287.70 further validated by the PBV ratio of 1. All of this shows that the bank has been improving its major indicators which is a good sign for investors.
.png)
FINANCIAL ANALYSIS OF HPPL AND RFPL, Could be better stocks in Hydropower Sector
HPPL and RFPL are hydro-power projects listed under NEPSE. Both of these companies had issued right shares in the fiscal year of 2082/83 resulting in the increase of their paid-up capital. HPPL has the paid-up capital of Rs. 1,598,125,500 according to its financial report of 4th quarter of fiscal year 2082/83. As HPPL has issued right shares of 1:0.5 ratio, its paid-up capital has increased in the fourth quarter and share premium has also been shown as 4,68,740 shares had been auctioned as ordinary shares. Table: Financial analysis of HPPL Company 4th Quarter Paid-up Capital(NPR) Share Premium (NPR) EPS Net worth per share Dividend capacity HPPL 2080/81 1,065,417,000 - -24.62 109.29 - 2081/82 1,065,417,000 - 6.82 116.10 16.10 2082/83 1,598,125,500 117,310,666 12.57 130.56 30.56 As for RFPL, it has the paid-up capital of Rs. 1,40,00,00,000 as shown in the financial report of 4th quarter of fiscal year 2082/83. RFPL had issued 1:1 ratio of right shares and auctioned 1,038,924 units. Table: Financial analysis of RFPL Company 4th Quarter Paid-up Capital(NPR) EPS Net worth per share Dividend capacity RFPL 2080/81 70,00,00,000 8.82 100.14 0.14 2081/82 70,00,00,000 0.15 100.52 0.52 2082/83 1,40,00,00,000 2.71 119.78 19.78 As we can see, there is a notable change in both company’s EPS and net worth capacity following the right share issue and paid up capital increase. The P/E ratio of HPPL and RFPL are 30.19 and 124.61 respectively while PBV ratio are 2.91 and 2.82 respectively. We can say that compare to some of the companies with similar paid up capital and similar market share price, these two seem better for the investors as their profitability has increased and have shown significant improvement in the fundamental indicators.




 (1) (3).png)
.png)




.png)
.png)


